
The “power and the curse” of high-frequency data

The “power and the curse” of high-frequency data
As economists and policymakers try to understand the impact of COVID-19 in real time, they’ve tapped nontraditional sources of economic information such as restaurant reservations, hourly-employee timecards and foot-traffic data collected from mobile phones.
Earlier this year, Ray Sandza, vice president of data and analytics at Homebase, which makes employee scheduling and time-tracking software, spoke with “Marketplace” host Kai Ryssdal about why such high-frequency data can shed light on what’s happening in the labor market between the Bureau of Labor Statistics’ monthly employment reports.
At the midpoint between the Labor Department’s August and September releases, Ryssdal checked in with Sandza about what Homebase’s small-business data shows. The following is an edited transcript of their conversation.
Ray Sandza: So what we’re seeing is that … there’s a higher level of suppression in hours worked, employees working. It looks like it’s about 7% down from where it was about a month ago. That’s not abnormal for the tail end of summer. The thing that is somewhat worrying here is that Main Street is a bit suppressed from where it would have been had COVID not happened.
Kai Ryssdal: Can you show me, through the miracle of Zoom, what this looks like?
Sandza: Yes. Do you see this screen?
Ryssdal: Yeah, you bet.
Sandza: All right. So if you just index our data to July, you’ll see that there’s been this consistent decline. We think a lot of this is due to COVID. And you can see the reference week is here, right?
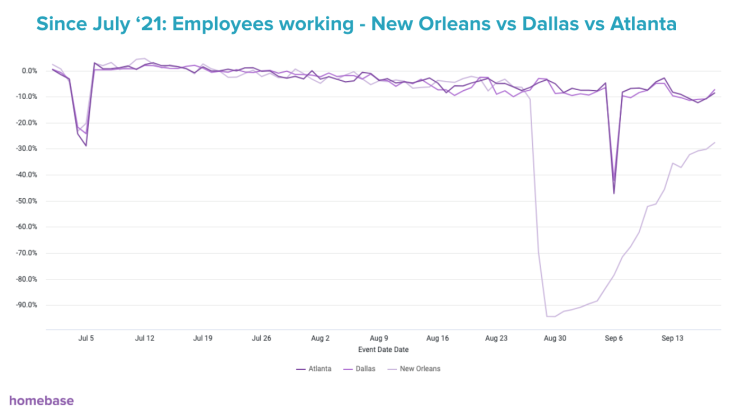
Ryssdal: And we should tell people what we’re looking at, right? It’s a chart that goes from the beginning of July, and then it’s a long, slow slide through July, through August. You see the big dip on Labor Day, and then there’s a dip on the 12th-ish of September, which is this past Sunday. So I don’t want to get all dorky here, right, but this reference week thing is important because that’s the data that shows up in the monthly jobs report. But what you’re telling me is you’re seeing it in a way that the monthly jobs numbers don’t manifest.

Sandza: Yeah. So what we see is we’re able to see the slide continuously between those two weeks. I think when we talked last time, the ice storm in Texas that happened, there was a big dip there that wasn’t reflected in the jobs report, and unfortunately, we have a similar thing going on right now with the hurricane in Louisiana. I could show you a chart there that shows the impact that that had on New Orleans — frankly, like, the devastation that happened over the course of a week will probably not be reflected in the jobs report.
Ryssdal: So you see in this data, just this chart I’m looking at, this “Since July 2021” chart, there are big drops of the Fourth of July and, and Labor Day, but there’s all kinds of other data bouncing around, right? There’s some spikes and some troughs and this and that, they’re, I mean, it’s noisy, I guess is the point. And high-frequency data does have to sort of carry that caveat, right?
Sandza: Yeah, it does. And certainly that happens when you try to zoom in more and more. So generally, things get smoothed over when you’re looking on a national basis, but if you were to go into an actual city, you can see things like a local football game really, like, drives things in a given week. So that’s both the power and the curse of this data, is that we can’t explain everything, we don’t try to explain everything, but we enable a lot of other, smarter people than us to try to explain things.
Ryssdal: All right, so talking about smarter people than you and me, there are a bunch of people who looked at the August jobs report, right, where we were expecting a big, big number, and it came in at 235,000. And everybody went, “Oh, my goodness, that’s terrible. What a surprise.” Were you surprised?
Sandza: So we don’t try to predict the jobs report. That’s not what we do. But we have learned through time — and lots of people told us — that there’s a correlation there. We happen to have deep insight into one of the most impacted industries right now, [and] we saw that in our set of employment, that that number went down, so we were not that surprised.
Ryssdal: So this is a tricky question to ask a guy whose job is data and analytics and who lives and breathes this stuff every day, but is it possible we have too much data?
Sandza: I actually do think so, and I’ll give you an example. One way in which we have too much data is that people can come in and they can prove whatever hypothesis they want. And so actually, I had a conversation with, with you guys about a month and a half ago on a finding that we saw where states that kept unemployment benefits in place had better outcomes than those that ended it, which would then say, “Oh my goodness, throw microeconomics out the wi — we don’t know what we’re doing!” Well actually, this correlation is meaningless, and we’re just not at the point where unemployment benefits are making a big difference, but that was not what people jumped to. So it’s not that we have too much data, it’s that we don’t have enough nuance.
Ryssdal: With great power comes great responsibility, right?
Sandza: Exactly. And that’s part of the reason why we don’t try to predict the jobs report. We give this to people, and then when people talk to me, they say, “Tell me what’s happening.” The world is complicated and there’s lots of variables, and so I can show the output, [but] I can’t always explain the inputs.
Stories You Might Like


There’s a lot happening in the world. Through it all, Marketplace is here for you.
You rely on Marketplace to break down the world’s events and tell you how it affects you in a fact-based, approachable way. We rely on your financial support to keep making that possible.
Your donation today powers the independent journalism that you rely on. For just $5/month, you can help sustain Marketplace so we can keep reporting on the things that matter to you.