Why inflation hits harder, depending on who you are

Why inflation hits harder, depending on who you are
In 2011, then-New York Federal Reserve Bank President Bill Dudley gave a public outreach speech in a working-class neighborhood of New York City. Reuters reported that after being bombarded with questions about rising food prices, Dudley pointed to the recently released iPad 2 to suggest that some prices were in fact falling. “Today, you can buy an iPad 2 that costs the same as an iPad 1 that is twice as powerful,” he said. To which an audience member replied, “I can’t eat an iPad.”
“I think [that story] just goes to show that, you know, maybe the prices of some things aren’t that important for some people,” said Jacob Orchard, an economics Ph.D. candidate at the University of California, San Diego, who’s studying inflation inequality.
While the most recent consumer price index data from the Bureau of Labor Statistics showed prices rising 8.5% annually at the end of March, your personal inflation experience depends on what you buy.
If you needed to buy a used car last year while prices soared, “it could have been that your inflation rate last year was, like, 30% because that’s when you were buying a car,” Orchard said. “So the actual topic of my dissertation is how the price index or the ‘inflation rate’ for low-income and high-income households can systematically differ over the course of the business cycle.”
As part of that research, Orchard has used data on consumer spending patterns to calculate different inflation rates for high-income and low-income households. “This last inflation report that we got, compared to March 2021, the inflation rate for low-income households was running at about 9%,” he said. “But for high-income households, it’s much closer to the average inflation rate at 8.5%. There is a gap.”
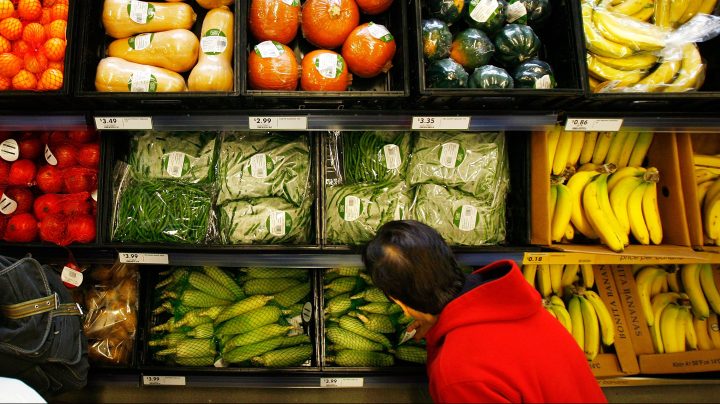
Low-income households tend to spend a bigger share of their overall budget on gas and groceries than higher-income households, which means they experience more inflation when those prices rise.
“But I want to be clear, when you ask people in a survey, [if] they care more about unemployment or inflation, they always they say unemployment,” said Stephanie Seguino, an economics professor at the University of Vermont. “They would rather live with some inflation and have a job than have low inflation and no job.”
Fighting inflation by raising interest rates can slow economic output and eliminate jobs. “We call it the sacrifice ratio,” Seguino said. “And the ‘sacrifice’ is disproportionately paid for by people of color — that is, African Americans and Hispanics are disproportionately likely to lose their jobs.”
Right now, prices are rising faster than they have for 40 years. At the same time, overall unemployment, at 3.6%, is approaching a 50-year low. But there’s a huge caveat there. In March, the Hispanic or Latino unemployment rate was 4.2%, and the Black unemployment rate was 6.2%.
“The overall CPI is meant to capture the spending patterns of a typical household, but really nobody’s the typical household,” said Daniel Sichel, an economics professor at Wellesley and chair of the National Academy of Sciences committee studying ways to modernize the consumer price index.
Your job, your age and your location all influence the particular basket of goods and services that you buy. Those differences can make measuring inflation difficult. “The Bureau of Labor Statistics does a really good job,” Sichel said, “but there’s plenty of room for improvement.”
In addition to the headline CPI for “all urban consumers,” the BLS publishes another version that’s meant to capture the inflation experience of older Americans and another for wage and clerical workers.
Sichel said the BLS could also use data on spending patterns to disaggregate CPI by income level, as Orchard and other researchers have done. “A step further than that would be to develop a data system where they really could link prices of particular items to the demographic characteristics of the people buying them — that would be kind of like the Holy Grail,” he said.
However, “I think it really comes down to resources,” he said, “and they would need additional resources to do that.”
Stories You Might Like


There’s a lot happening in the world. Through it all, Marketplace is here for you.
You rely on Marketplace to break down the world’s events and tell you how it affects you in a fact-based, approachable way. We rely on your financial support to keep making that possible.
Your donation today powers the independent journalism that you rely on. For just $5/month, you can help sustain Marketplace so we can keep reporting on the things that matter to you.


