Getting a clearer picture of wildfires from thousands of miles into space
The Dixie fire in Northern California has spread more than 700 square miles, making it the largest single fire in California’s history. There are more than 5,000 firefighters working on the ground to contain it.
Increasingly, technology is aiding firefighting efforts like this one — from above.
Andre Coleman, a data scientist at Pacific Northwest National Laboratory, helped create a system using data from satellites to analyze everything from vegetation and soil moisture to topography to map the boundaries of a fire and predict what it will do next.
He says the system, which launched in May of this year, is faster and more precise than the traditional way of mapping fires. The following is an edited transcript of our conversation.
Andre Coleman: Right now, for most fires, you have imaging aircrafts that image these fires, and that’s typically done at night. So, being able to increase the frequency with which we can collect data, provide those analytics, ultimately translates into more effective fire management. It’s about being able to effectively deploy resources in the right places, to protect resources like critical infrastructure, community structures, so forth, that are out there.
Meghan McCarty Carino: I understand your team also looks at imaging from other sources, like social media for real-time images of a disaster. Say a person is near a fire and they tweet a picture, how does that get used?
Coleman: So this capability that’s referred to as Rapid Analytics for Disaster Response, what we’re talking [about] here is the wildfire component of that. The broader capability of RADR, for short, really works towards all hazards, so whether this is [a] hurricane, flood, or tornado, or earthquake, tsunami, or what have you, and in that broader capability, that’s where we’re building in the social media aspect. The idea is that we can take social media photos, curate those, validate where those photos were taken, and then extract information. We’re using deep learning technologies to extract information out of those photos, understand what’s being seen in that photo, and then be able to translate that in the mapping space. That’s a process that is really about two things: one is to validate our satellite imaging collections, but also to help fill in gaps. In cases like hurricanes and floods, we don’t always have imagery when we need it. But the speed of social media keeps coming in, so we can use that to help inform.
McCarty Carino: It seems there’s a lot of action in this space of digital mapping and kind of predictive intelligence tools to predict wildfires, floods, things of this nature. How does the tool that you’ve developed compare to a lot of the developments in the private sector, with startups and that kind of stuff?
Coleman: What we’ve developed is really a little bit unique, I would say, in being able to harvest data from multiple satellites, very high-resolution satellites. And often what’s being used in wildland fire and even what I see in private industry, is the reliance on a set of satellites, and these are coarser satellites. We are also moving into a fire propagation model, or fire spread forecast models, to say, ‘Well, this is the current condition of the vegetation. This is how much the vegetation is stressed. This is the soil moisture.’ All these things that we need to feed a fire forecast model.
McCarty Carino: What are the problems that you and the industry are still trying to solve? What would make this even more effective?
Coleman: One of the biggest problems we have right now for satellite imaging is to be able to get that information pulled down quicker. There is technology that’s being now coupled with our communication satellites where you can transfer that data from the Earth observation satellite to the communication satellite, which can ultimately get to a downlink station. Right now, satellites have to be within a line of sight of a downlink station before they can download that imagery, so that’s a gap. With the newer advancements, we’ll be looking at being able to get imagery pulled down and ready for analysis within 90 minutes or so. Right now, the process is more in the order of hours.
McCarty Carino: Given the reality that we face with climate change, of more and more intense fires, what do you think the implications are for this kind of technology?

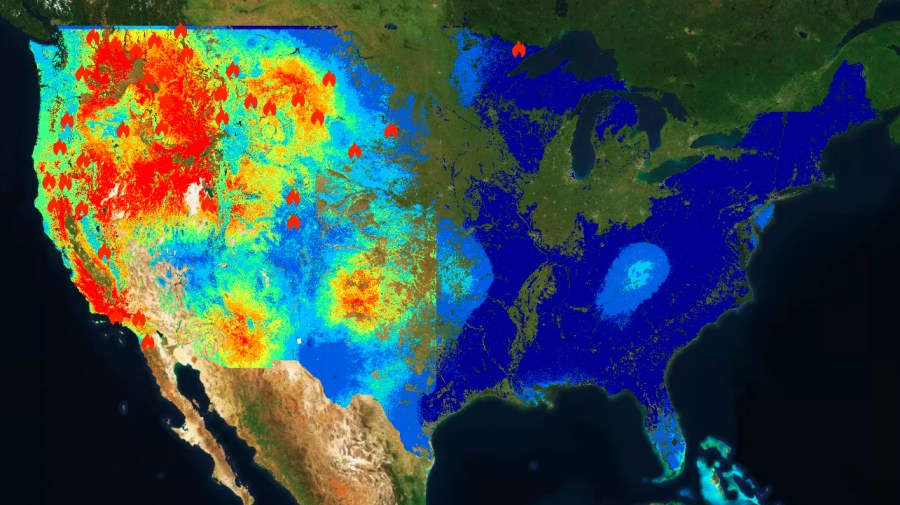
(Courtesy Pacific Northwest National Laboratory)
Coleman: Right now, we’re at a national preparedness level five, which is the highest preparedness level, and really what this means is that we’ve got so many fires going right now that we’ve pretty well allocated all the available resources. And so it’s really times like this where we have to up our game in terms of being able to take the tools, take the technology and the data that’s available out there, and apply those to these fires. The same can be said for hurricane and flooding, where we’re seeing a higher frequency of those storm events, and so it’s really about getting more informed decision-making in there so that we can manage those events better. But we also see, specifically with fire, that there’s the impacts that the fire has directly to the landscape, to communities, to critical infrastructure. But it’s also the downstream impacts of that, that come later or are found in different ways, in terms of air quality and health. Debris flows and floods that will come later, more particulates in the air which can affect hydrologic cycles. The list goes on in terms of the numbers of impacts.
Related Links: More insight from Meghan McCarty Carino
You can check out the fire map from the Pacific Northwest National Laboratory. If you want to see the massive perimeter of the Dixie Fire in Northern California, zoom in. It’s just north of Lake Tahoe. The map also tracks every other fire every where else in the country, if you want to get a sense of what’s going on, particularly across the west of the country right now.
We mentioned that there’s a lot going on in the space of mapping and predictive technology, and NBC News reports here on some of the developments. One German company, OroraTech, is partnering with SpaceX to launch a series of nano-satellites (about the size of a shoe box) and its software is already used in other wildfire hot zones like Canada and Australia. There have been a proliferation of fire-tracking AI startups in Silicon Valley, which makes sense — the area is directly in the line of fire, so to speak.
Stories You Might Like


The future of this podcast starts with you.
Every day, the “Marketplace Tech” team demystifies the digital economy with stories that explore more than just Big Tech. We’re committed to covering topics that matter to you and the world around us, diving deep into how technology intersects with climate change, inequity, and disinformation.
As part of a nonprofit newsroom, we’re counting on listeners like you to keep this public service paywall-free and available to all.
Support “Marketplace Tech” in any amount today and become a partner in our mission.