Amid massive rainfall and deadly flooding, how does tech help identify risk?
World leaders are gathering for meetings this week at the United Nations General Assembly in New York. Among the topics they’ll discuss is the ravages of climate change.
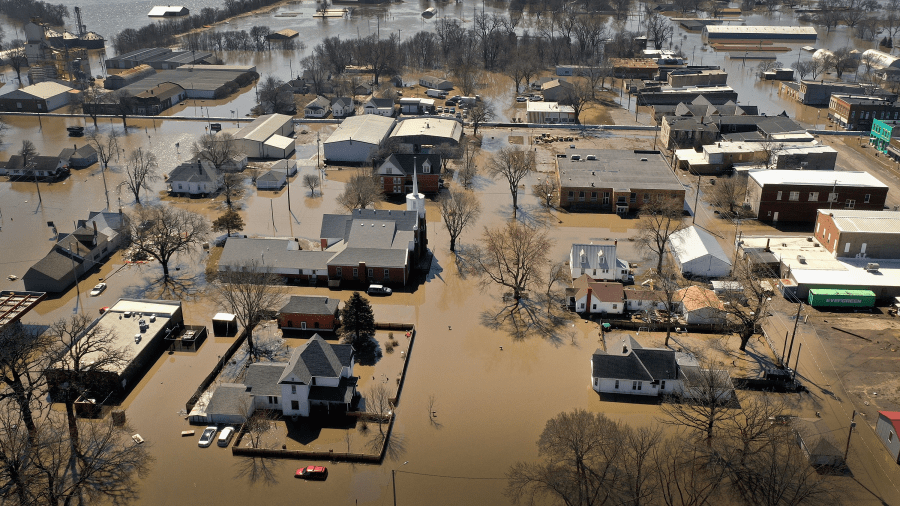
This year, climate damage across the U.S. has included devastating flooding in Tennessee, New York, Louisiana and elsewhere.
Some people know they face flood risk, but many do not. That’s largely because the official federal flood maps are often outdated and may not account for the effects of more powerful storms.
We wanted to know how technology is advancing the mapping effort. Michael Grimm is assistant administrator for risk management at the Federal Emergency Management Agency, which manages flood mapping. He said the agency continuously updates its tech, like lidar, which is short for light detection and ranging. The following is an edited transcript of our conversation.
Michael Grimm: What’s so amazing about lidar is that, in the past, we used traditional surveying technologies in the 20th century to collect flood data. That’s people going out on the ground and actually surveying. And it’s been replaced by lidar. So now what we do is we shoot lasers at the ground from an airplane, and it bounces back to the plane. We can convert that information to highly accurate elevation data for vast areas of the country at a much lower cost.

Jed Kim: What other technology is the agency thinking about incorporating when it comes to map creation?
Grimm: Twenty years ago, our entire flood map inventory was paper maps, and they basically looked like state highway maps that you might have in your glove compartment of your car, but they weren’t that conveniently located. So somebody wanting to know if they were in a flood zone would often have to go to a local government office or a library to find that paper FEMA map and unfold it and interpret whether or not they’re at risk. Over the last 20 years, we’ve been working tirelessly to transform that inventory into a digital product. So a homeowner can now go online and type in their address, get the hazard information online from our National Flood Hazard Layer, more similar to using a mapping software on your iPhone or your computer to find the nearest gas station.
Kim: Now, I’ve covered flooding a fair amount, and so many people that I’ve talked to have talked about how these maps are, they’re woefully lacking. We have the technology, it’s getting cheaper. Why is it taking so long to update them?
Grimm: I think stepping back and looking at some of the comparisons that people make of the flood maps to recent events, you’ll see that it’s really comparing apples to oranges. So if you look at the recent flood events in Tennessee, for example, that clearly demonstrate that storms much larger than what are shown on FEMA maps occur, and we believe are occurring with increasing frequency as a result of climate change. There were 17 inches of rain which fell in a 24-hour period. That is much larger than a 100-year flood, than what’s shown on the FEMA map. The actual updates of the FEMA maps are done on a five-year rolling basis, and keeping that mapping inventory up to date is critical to keep up with the science, to keep up with the technology to benefit the public and understand flood risk.
Kim: Does that mean that in five years from now, we will have maps that adequately assess the risk for people?
Grimm: So five years from now, we’re going to, we’re going to keep maintaining the inventory that we have, and as I said, we’re looking at new ways to look at risk in terms of a range of flood possibilities. The current maps, the limitation of those is that binary depiction of risk. So the “in or out” version of the view of the flood plain, where we all know it floods in other areas, such as urban areas, more frequently, or much larger events that aren’t depicted on the flood map. And FEMA is at the forefront of developing a new approach and a more comprehensive view of flood risk under what we call the Future of Flood Risk Data initiative.
Kim: Michael, what is the biggest bottleneck to getting these maps updated?
Grimm: Making the maps takes time. It’s very complex. It requires a lot of information. And because these are regulatory maps, they also take time to get through the public review period and the due process. In order to get through the process, we have to be very deliberate. We work very closely with state and local governments. It’s key to work with our state and local governments to get that the best information we can, the most comprehensive view of risk and then to get those communities to adopt that information and make land-use decisions and building decisions based on the best risk data.
Kim: If flood insurance is expensive, do you get pushback when you update maps to show increased risk of flooding?
Grimm: We certainly get interest as the map changes. We certainly hear from stakeholders more so when they’re put in the flood plain than taken out of the flood plain. In general, there’s probably about the same amount of folks that come out of the flood plain when we do our remapping as go in the flood plain. But obviously, we will hear more from folks that get put in the flood plain that way. The key is we’ve got to convince people that don’t think it’ll happen to them, because risk is often perceived based on what you’ve experienced or what somebody you love or know has experienced. And you know, just because you haven’t had a flood at your home in the last 10 years, 20 years or 30 years doesn’t mean you won’t experience a flood. And we need to, we need to do a better job at risk communication across all areas and across not just flooding but lots of other hazards as well.

Related links: More insight from Jed Kim
One very important function of the flood maps is that they determine whether you’re eligible for the National Flood Insurance Program. The NFIP is chronically underfunded and often criticized for allowing participants to rebuild in risky areas. Still, it’s a lifeline for homeowners who can’t afford private flood insurance. Democrats are moving to inject billions of dollars for the program. Some of it would be used to help subsidize insurance for low- and middle-income families. Three billion would go to helping improve flood maps. That, according to Climatewire, is twice what has gone to mapping in the past seven years combined.
What is the private sector doing when it comes to flooding and tech? Well, one tech startup called Cloud to Street provides global flood mapping using satellites and artificial intelligence in near-real time. Some of its research was published in the journal Nature in August. The company looked at satellite images from 2000 to 2015 and found that globally, the proportion of people exposed to floods grew by as much as 24% over that time period. That’s 10 times higher than what was previously estimated.
Wondering whether you need flood insurance? There’s this somewhat dire quote from a MarketWatch article. “If it rains where you live you should consider flood insurance.” The article points out that many people mistakenly think they’re covered when it comes to flood damage. Standard home insurance rarely covers it.
And finally, just to give a sense of what’s at stake with all of this, Redfin has an analysis that shows that over four years, from 2016 to 2020, more people moved into risky areas than moved out. The counties with the most homes at climate change risk from high heat, drought, fire, flood and storms grew, and places with the least risk shrank.
Stories You Might Like


The future of this podcast starts with you.
Every day, the “Marketplace Tech” team demystifies the digital economy with stories that explore more than just Big Tech. We’re committed to covering topics that matter to you and the world around us, diving deep into how technology intersects with climate change, inequity, and disinformation.
As part of a nonprofit newsroom, we’re counting on listeners like you to keep this public service paywall-free and available to all.
Support “Marketplace Tech” in any amount today and become a partner in our mission.