What’s a point on the Dow, S&P or Nasdaq?

What’s a point on the Dow, S&P or Nasdaq?

This is just one of the stories from our “I’ve Always Wondered” series, where we tackle all of your questions about the world of business, no matter how big or small. Ever wondered if recycling is worth it? Or how store brands stack up against name brands? Check out more from the series here.
Marketplace listener Ken Wonder of Bloomington, Indiana, posed this “I’ve Always Wondered” question:
What constitutes a point on the Dow, Nasdaq or S&P?
We’ll start with the Dow — it’s the oldest stock index, and it’s calculated differently from the others.
Think back to 1884: Men of means were wearing silk top hats and speculating in railroad stocks.
“Charles Dow and his partners Edward Jones and Charles Bergstresser were putting out a two-page bulletin that they would circulate in the firms in Wall Street,” explained Thomas Stapleford, an economic historian at the University of Notre Dame and author of the book “The Cost of Living in America: A Political History of Economic Statistics.”
“In 1884, they started calculating an average of the prices of 12 stocks. And 10 of those stocks were railroad stocks, the other two were Western Union and Pacific Mail, which was a steamship company,” Stapleford said. “They thought about the market as being like a wave that had peaks and valleys, thinking traders want to do more than just track individual stocks. They want to get some sense of what’s happening in the overall market over time.”
In 1896, they started publishing a new stock average in the financial newspaper they created — The Wall Street Journal — based on 12 big industrial companies. The Dow Jones Industrial Average was literally that: the average cost of a share in those companies. It started out around $30, and a point was $1.
But in subsequent decades, that 1-point-to-$1 equivalence went away. The average was adjusted for things like stock splits and mergers. Some companies were dropped and others were added, bringing the total to 30 companies.
The Dow’s biggest problem today, Stapleford said, is that it’s weighted by the prices of shares, which can vary a lot.
“So think about a $1 change in a $10 stock. That’s 10%, a big deal. A $1 change in a $100 stock is only 1%, and that’s a much smaller issue. But that $1 change in the $10 stock has the same effect on the movement of the overall Dow Jones as the $1 change in the $100 stock.”
By contrast, the S&P 500 and Nasdaq composite — developed decades later — include far more companies and weight them according to their market capitalization. In other words, the cost of a share is multiplied by how many shares have been issued.
“Each of those stocks is weighted by the market value of all the stocks in that index,” said Santa Clara University finance professor Meir Statman. “So a 1% change in the price of Apple has greater effect on the index than, say, Macy’s, which is among the smallest.”
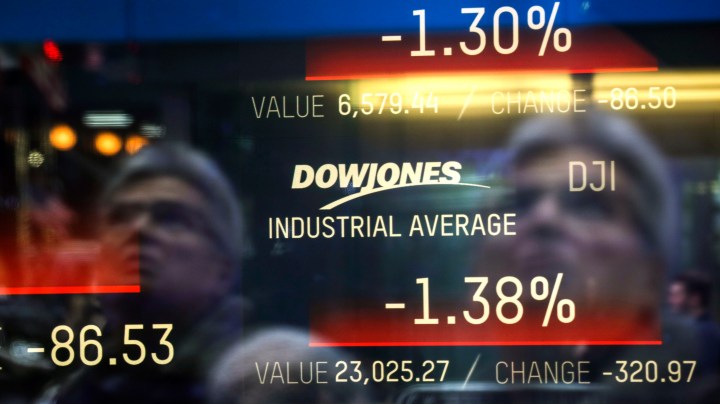
One thing nearly everyone agrees on: Ignore the point changes, it’s the percentage changes that matter.
That’s because each index has a different baseline, said Richard Sylla, emeritus finance professor at New York University. Right now, the S&P 500 index is in the low 4,000 range, the Nasdaq composite is in the mid-14,000s, and the Dow Jones Industrial Average is in the high 34,000s. “If you have a 100-point move in the Dow index,” Sylla said, “that’s three-tenths of a percent. Nasdaq, that’s 0.7%. In the S&P index, that’s 2.3%.”
“Surely it would be better if results are reported in percentages,” Statman said. “This way, people don’t have to keep in mind the current level of the index to make sense of what 500 points on the Dow are.”
Some investment advisers, including Statman, think we should all pay less attention to the daily fluctuations in these indexes, whether points or percents, and focus on the long term.
But economic historian Stapleford said our collective obsession with market index numbers is associated with a broader cultural change that occurred as the U.S. emerged from World War II into the boom years of the 1950s and 1960s, “when we — as a country, not just a group of economists or investors — began looking to statistics as a way of gauging what’s happening in the economy as a whole.”
And he pointed out that index values for the Dow, S&P and Nasdaq, reported daily or multiple times per day on broadcast news, “is different than unemployment, the consumer price index or [gross domestic product] — which are at best monthly measures. Here you can get a daily update, feeling the pulse of what seems to be going on in the economy.”
Stories You Might Like


There’s a lot happening in the world. Through it all, Marketplace is here for you.
You rely on Marketplace to break down the world’s events and tell you how it affects you in a fact-based, approachable way. We rely on your financial support to keep making that possible.
Your donation today powers the independent journalism that you rely on. For just $5/month, you can help sustain Marketplace so we can keep reporting on the things that matter to you.