Oil and big data: how to flatten the crude curve


The oil industry needs to flatten its own curve. A new industry of satellite imagery, geolocation data and other artificial intelligence tools has cropped up to provide fast, independent information on where the crude is in the world.

Oil is the new data?
In the bad old days, info on drilling, selling, shipping and storing oil came after the fact; you had to wait a month, or six, for governments to tell you.
And sometimes they were lying.
Cheaters sometimes prosper
“The history of OPEC deals is that they take on quotas, and countries cheat,” said David Goldwyn, international energy consultant at Goldwyn Global Strategies. “1986: Venezuela was hugely cheating on its quota. They said they weren’t, and it was clear from the market impact they were.”
But now, big data in oil fancies itself a real-time BS detector. One example: satellite maps of nitrogen-dioxide pollution from cars and factories, corresponding to petroleum use. Note this GIF from the data analytics firm OilX comparing U.S. pollution last year to this year.

Clear skies, but not much energy use. The GIF for India looks similar.
“India has been lagging a bit [in the] spread of coronavirus,” Florian Thaler, the co-founder of OilX, said. “But now we do see indeed there has been a significant change.”
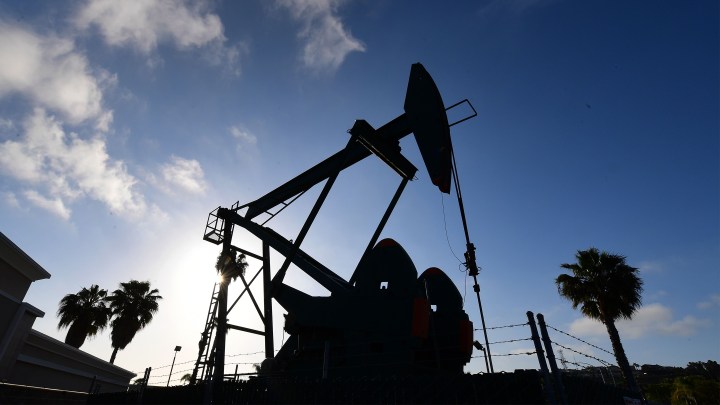
The collapse in oil use means a whole lotta crude is squeezing into storage tanks around the world. Here’s a tank farm in Cushing, Oklahoma.

Look carefully: storage tanks have floating roofs that go up and down, so you can spot the empty ones. They kinda resemble empty green-bean cans where you can see all the way down.
Thaler sees tanks filling up fast, in places like Cushing and Rotterdam, in the Netherlands. “Rotterdam over the last two weeks we have seen a significant increase in stocks there,” he said.
Another oil analytics firm, Kayrros, turns satellite pics into cool 3D visuals. Like these representations of the critical Kiire oil storage facility in western Japan. Yep, filling up.
![]()
January 2020 ![]()
April 2020


Put it all together, and oil going into storage is ramping up.

But what about the flattening?
So here’s where flattening comes in. Just as the world is trying to flatten the COVID-19 curve to avoid running out of medical capacity (hospital beds, doctors, ventilators), oil producers are trying not to run out of storage capacity.
If that does happen, prices would crash, analysts say. And drillers would shut down wells, in some cases forever. If you stop pumping an old well, you can lose underground pressure to push the crude back up, explains oil scholar Amy Myers Jaffe at the Council on Foreign Relations.
“Some people are speculating that if Russia has to shut in its production … they will not be able to reopen them.”
Amy Myers Jaffe, Council on Foreign Relations
Thaler of OilX thinks the new OPEC+ agreement — in which Saudi Arabia, Russia, Norway and other key producers pledged on Easter Sunday to cut production by nearly 10 million barrels a day — will allow a “near miss” so storage doesn’t run out. Here’s his chart again:
One means of avoiding what the industry calls “tank tops” is stashing oil in tankers. That’s happening on a large scale, according to this OilX map loaded with stationary tankers around the world.

And to eventually ramp the curve down, China has to rev its economy to burn more oil. There are signs. Here’s the NO2 pollution map of China, before and now.
![]()
February — China NO2 pollution ![]()
April — China NO2 pollution


At Kayrros, co-founder Antoine Halff sees Chinese industrial activity increasing as well, using satellite images and anonymized geolocation data from cellphones.
“We’ve been watching traffic in shopping malls, we’ve been watching road traffic, workers showing up at various factories,” Halff said. “And we’ve seen gradually a restart of economic activity in China.”
Stories You Might Like


There’s a lot happening in the world. Through it all, Marketplace is here for you.
You rely on Marketplace to break down the world’s events and tell you how it affects you in a fact-based, approachable way. We rely on your financial support to keep making that possible.
Your donation today powers the independent journalism that you rely on. For just $5/month, you can help sustain Marketplace so we can keep reporting on the things that matter to you.