
Misleading charts are everywhere. Here’s how to spot them.
Misleading charts are everywhere. Here’s how to spot them.


The following is an excerpt from Alberto Cairo’s book “How Charts Lie: Getting Smarter About Visual Information.” In it, he details the important role charts play in shaping our beliefs, and how people can improve their graphicacy, or chart literacy.
Economist Ronald Coase once said that if you torture data long enough, it’ll always confess to anything. This is a mantra that tricksters have internalized and apply with abandon. As the charts that confirmed Dylann Roof’s racist beliefs demonstrate, the same numbers can convey two opposite messages, depending on how they are manipulated.
Imagine that I run a company with 30 employees, and in the annual report that I send to shareholders, I mention that I care about equality and employ the same number of men and women. In the document, I also celebrate that three-fifths of my female employees have higher salaries than male employees of the same rank, to compensate for the fact that women in the workforce tend to make less money than men. Am I lying? You won’t know unless I disclose all the data as a table:
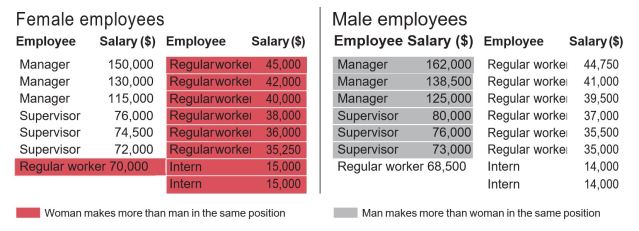
I may not have told you a complete lie, but I’m not disclosing the whole truth, either. A majority of my women employees have higher salaries than the men, but I concealed the fact that, on average, men in my company make more than women (the means are $65,583 and $63,583), because managerial salaries are so unequal. Both ways of measuring equality are relevant if I want to provide a truthful picture of my company.
This is a fictional example, but similar ones in the news media abound. On February 22, 2018, BBC News wrote, “Women earn up to 43% less at Barclays—Female employees earn up to 43.5% less at Barclays than men, according to gender pay gap figures it has submitted to the government.” This isn’t a lie, either. The pay gap at Barclays Bank is indeed large. However, as data analyst Jeffrey Shaffer pointed out, that 43.5% difference doesn’t tell the entire story. We need to take a look at charts like this because they reveal an angle we may have overlooked:

Barclays does have an equality problem, but it isn’t a pay gap at the same levels in the hierarchy—men and women in similar positions earn nearly identical salaries, according to a report by the bank. Barclays’ challenge is that women employees are mostly in junior positions and managers are mostly men, so the key to solving the problem may be its promotion policies. Jes Staley, CEO of the bank, said, “Although female representation is growing at Barclays, we still have high proportions of women in more junior, lower paid roles and high proportions of men in senior, highly paid roles.”
Numbers can always yield multiple interpretations, and they may be approached from varied angles. We journalists don’t vary our approaches more often because many of us are sloppy, innumerate, or simply forced to publish stories at a quick pace. That’s why chart readers must remain vigilant. Even the most honest chart creator makes mistakes. I know this because I’ve made most of the mistakes I call out in this book—even though I didn’t wish to lie on purpose!
Excerpted from How Charts Lie: Getting Smarter About Visual Information. Copyright (c) 2019 by Alberto Cairo. Used with permission of the publisher, W. W. Norton & Company, Inc. All rights reserved.
Stories You Might Like


There’s a lot happening in the world. Through it all, Marketplace is here for you.
You rely on Marketplace to break down the world’s events and tell you how it affects you in a fact-based, approachable way. We rely on your financial support to keep making that possible.
Your donation today powers the independent journalism that you rely on. For just $5/month, you can help sustain Marketplace so we can keep reporting on the things that matter to you.